SPY, SPX, and ES_F — charts do not get much clearer or uglier than these
- Posted by PeterLBrandt
- on September 2nd, 2011
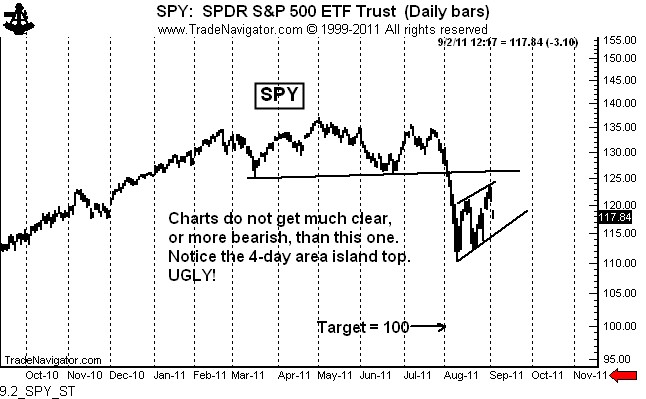
The daily charts of $SPY, SPX and $ES_F are as clear a picture as I have seen in years — and the outlook does not get much uglier.
The daily charts of all three versions of the S&Ps exhibit two dominant patterns:
- A classic, textbook H&S top of MAJOR magnitude. A H&S top pattern — a true H&S such as we have here — represents a change in the dominant underlying trend. Stocks are in abear market.
- A classic, textbook bear flag. These flags are typically “half-mast” in nature, meaning that SPY has a target of 100 for this push down.
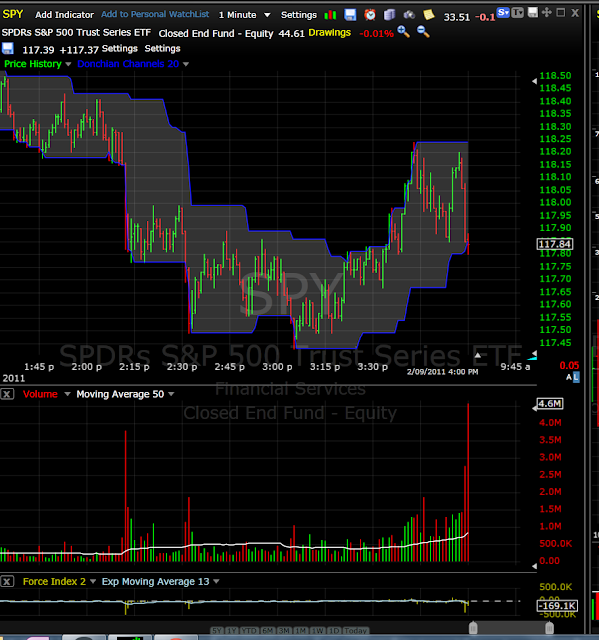
VOLUME MATTERS
RARE CHART PATTERN: Island Reversal From Short Term Top


