Equity futures are tumbling on the Employment Situation Report which came in with a headline nonfarm payroll increase of 54,000 against expectations of 170,000 – an even larger miss than was expected following the ADP report. The headline U-3 Unemployment rate rose from 9.0% to 9.1%. Both March and April were also revised lower, losing an additional 39,000 jobs.
The dollar is slightly higher, bonds are shooting higher, oil is down, gold is holding steady, silver is slipping, and food commodities are mixed.
Below is the entire report from the BLS:
Employment MAY 2011
Here is Econospin’s reaction to it:
Highlights
Analysts had lowered their forecasts after an anemic ADP private payrolls report but they did not lower them enough as growth was very soft. Nonfarm payroll employment in May grew a modest 54,000, following a revised 232,000 jump in April and a 194,000 increase in March. The May figure came in lower than analysts' revised forecast for a 170,000 expansion. Also, the March and April revisions were down net 39,000. Private nonfarm payrolls advanced 83,000 in May, following a 251,000 increase in April. The median forecast was for a 180,000 increase in May.
Sluggishness in payroll jobs was broad based. Goods-producing jobs were basically flat while private service-providing rose moderately and government jobs declined moderately.
Goods-producing jobs edged up 3,000, following a 38,000 rise in April. Manufacturing jobs dipped 5,000 after a 24,000 advance the month before. However, construction nudged up 2,000 after a 5,000 increase in April. Mining gained 7,000, following an 11,000 boost in April.
Private service-providing jobs slowed to an increase of 80,000 after a 213,000 jump the prior month. There was not much to write home about as the biggest component gain was for professional & business services with a 44,000 increase in May. Health care rose 17,400 for the latest month. On the down side, retail trade fell 8,500 while leisure & hospitality dipped 6,000.
Government jobs contracted 29,000, following a 19,000 dip in April. This latest decrease was largely local government, led down by local government education.
On a positive note, wage growth improved in May as average hourly earnings rose 0.3 percent, following a 0.1 percent uptick in April. May's number topped the median forecast for a 0.2 percent increase. The average workweek for all workers in May held steady at 34.4 hours.
On a year-ago basis, overall payroll jobs in May eased to 0.7 percent, down from a 1.0 percent pace the month before.
Turning to the household survey, the unemployment rate nudged up to 9.1 percent from 9.0 percent in April. Household employment actually rose 105,000 for the month but was outpaced by a 272,000 gain in the labor force.
The big question is whether the May numbers are a temporary soft spot or a new trend. The Labor Department indicated that severe weather did not play a notable role in the data. While the recovery/expansion has gained traction, the trajectory is somewhat lower than earlier believed.
On the news, equity futures dropped sharply.

First of all, it takes approximately 260,000 jobs added each month just to keep up with population growth. Taken at face value then we are losing a massive number of jobs. But of course we don’t take these numbers at face value as they are manipulated beyond belief.
The trend of government layoffs continues, with local governments laying off large numbers of workers. Not a part of this report, but just yesterday Minnesota announced they are laying off 36,000 workers statewide.
Let’s look at the “Alternate Table” where we find the better measurement of the unemployment rate under the U-6 column where we count “marginally attached workers,” we find a 15.8% seasonally adjusted unemployment rate, which is actually down .1%:

Of course John Williams at ShadowStats puts this figure closer to 23%:

Those numbers are calculated closer to the way they were during the Great Depression, and today’s numbers rival those from that time. Of course they didn’t have 43 million Americans on food stamps, they had breadlines.
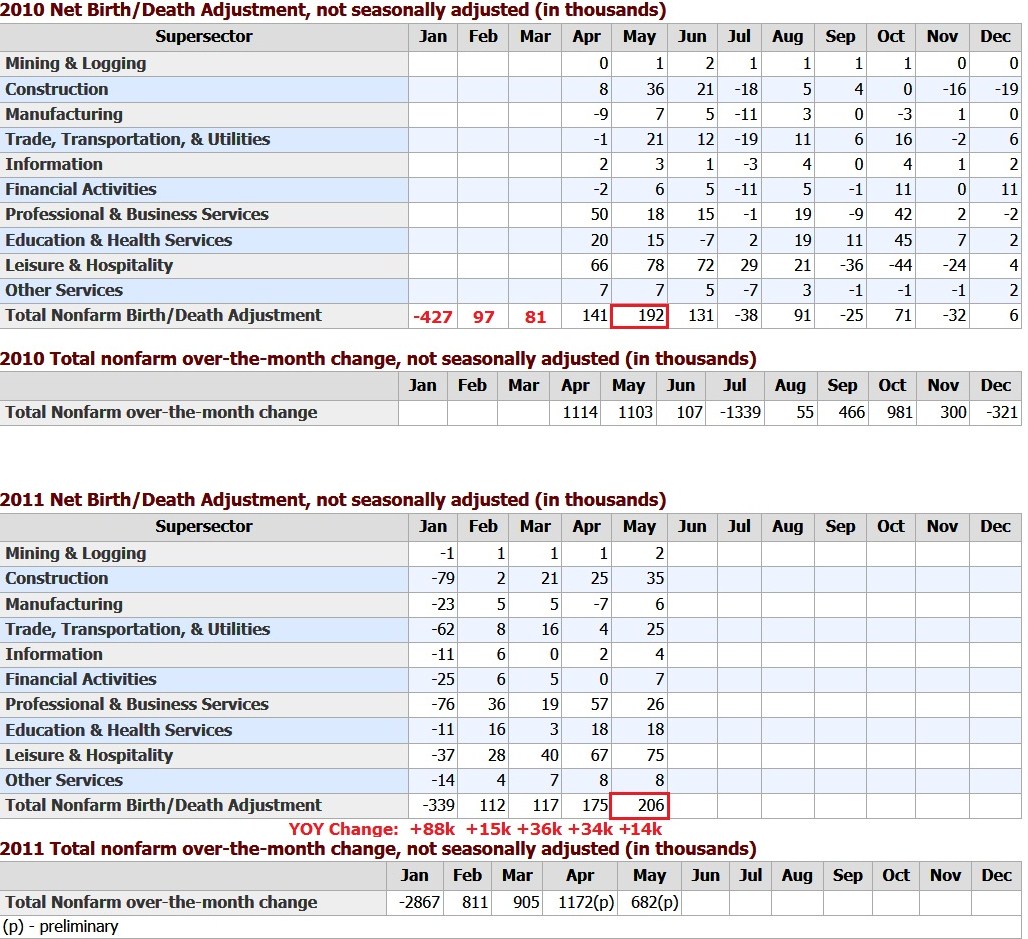
The phony “Birth/ Death Model” added another 206,000 jobs (headline number would be hugely negative if not for this). This marks the fifth month in a row where the BLS is adding more jobs via this model this year than last, 187,000 so far in fact:
Just for fun, I created a chart showing the outrageous Mean Duration of Unemployment and compared it to the base money supply:

It may look like one is leading to the other, but in fact I think they are both a reaction to reaching the macroeconomic debt saturation point. Once that point is reached, then adding more debt or even printing more money will only lead to further unemployment as the cost to carry that debt adds more and more burden to the economy. This concept is the one that puts the complete lie to all the supposed economic experts as the diminishing returns of debt creation have already shown.
The Non-Manufacturing ISM is released at 10 Eastern this morning and will be covered inside today’s Daily Thread.
The markets are very close to breaking their April lows. Should they do so on a closing basis, then it sets up a major DOW Theory non-confirmation as the Transports have made a new high, but the Industrials have not.
Clearly the economy is slowing again, the effects of money printing waning. There was no “recovery,” just printing.