Could Strength in Copper Forecast Stock Strength? Level to Watch JJC
Jul 23, 2010: 1:03 PM CST

In general, copper prices travel in the same direction as stock prices, as copper is an industrial metal that is sensitive to good or bad changes in the economy.
As such, we can watch copper prices to see potential turns in the stock market. The S&P 500 is stuck under resistance at 1,100, just as copper is stuck at resistance at $3.200.
However, we’ve seen strong bounce over the last few days in copper – could that forecast strength in stocks? Let’s take a look at the resistance level to watch in copper prices and the JJC copper ETF to see if we can pick up any clues.
First, Copper Futures Prices (Daily chart):

As seen in the continuous futures contract of copper (@HG via TradeStation), Copper prices face confluence resistance at $3.2000.
Why?
The 200 day SMA rests currently at $3.2126, so we’ll need to keep a watch on that – a break above the 200 day moving average would be a bullish turn-around – so traders should watch that closely.
Also, the 50% Fibonacci retracement of the move down from the April high (along with stocks) is $3.2011 – right there with the 200 SMA and prior price high spike from late May.
Beyond the confluence resistance there, price seems to have broken upwards from a symmetrical triangle – notice the multi-day impulse move on the breakout (it’s bullish).
If the triangle pattern completes its upside target, we could see a move up to the 61.8% Fibonacci retracement at the $3.3000 level.
That’s the parameters on the daily chart – remember that stocks have their upside resistance levels too.
If you don’t have access to watch copper futures prices – or want to trade a potential move here without using futures – you can study the JJC copper ETF.
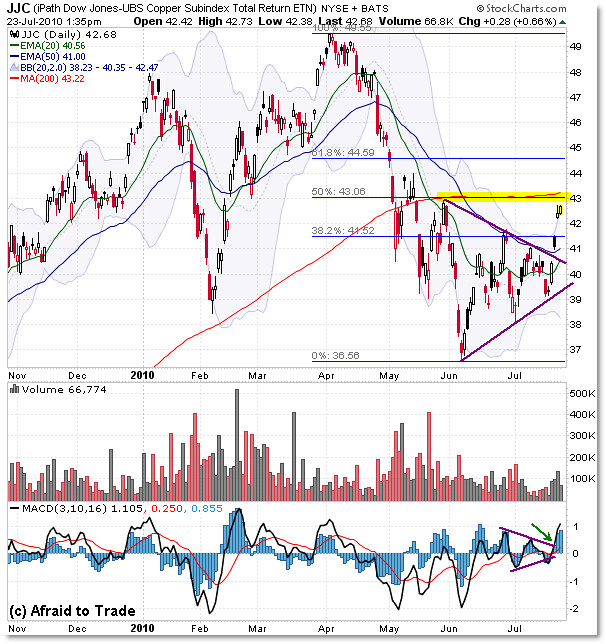
Let’s see the daily chart of the Copper ETF – symbol JJC (Daily):

I won’t go into as much detail, but the chart structure is similar, though the key level to watch is $43.00 per share in the JJC ETF.
That’s because the 200 day SMA rests at $43.22 and the 50% Fibonacci retracement lies at $43.06.
These will be the levels to watch for a potential upside break – $3.2000 in copper futures and $43.00 per share in JJC.
Either copper and stocks will fail to overcome resistance here and thus swing lower (continuing their downtrends), or the will likely break upwards together, sending both copper and stocks into an upward impulse above their resistance levels.
Either way – we should know the outcome soon – early next week that is.
Watch closely.
Corey Rosenbloom, CMT