Headline employment data for June – Rate fell to 9.5%, with the headline number on consensus of minus 125,000. Private Payrolls missed the 105k consensus at 83k. Birth/Death adjustment fell from 215k to 147k.
Futures ramped initially, immediately fell back to flat, then proceeded to climb into the green. The dollar continues to fall sharply, euro higher. Bonds are lower and yesterday they put in a candle that looks rather toppy. Oil is flat, gold is up slightly – both convincingly broke support yesterday.
Regarding the employment numbers, keep in mind that the rate is calculated from the household survey and thus it can be disconnected from the headline calculation. When we dive into the report, we find that the reason the rate fell is because there was a sharp drop in the labor force! The Participation rate fell .3%, and the employment-population ratio fell as well. Here’s Econoday:
Highlights
The jobs picture in June was quite mixed as temporary Census workers were laid off and private hiring was positive but moderate. Also, the unemployment rate continued to dip even as the workweek slipped. Overall payroll jobs in June fell back 125,000 after spiking a revised 433,000 in May and after a 313,000 jump in April. The June decrease was matched the market forecast for a 125,000 decline.
Looking beyond the temporary effects of Census hiring and firing, private nonfarm employment increased 83,000, following a 33,000 rise in May. The latest figure fell short of analysts' projection for a 105,000 advance in private payrolls.
The private sector gain was led by a 91,000 boost in private service-providing jobs. This included professional & business services, up 46,000, and leisure & hospitality, up 37,000. The goods-producing sector lost a net 8,000 payrolls with construction down 22,000. Manufacturing posted a 9,000 gain while mining & logging advanced 5,000. Manufacturing has risen three months in a row.
The big weakness, of course, was a 208,000 drop in government jobs after a 400,000 jump in May. The decline included the loss of 225,000 temporary employees working on Census 2010. Employment in both
state and local governments was little changed over the month.
On a year-ago basis, overall payroll jobs improved to down 0.1 percent in June from down 0.4 percent the prior month.
There other signs of a slowing in the labor market. Growth in average hourly earnings eased to a 0.1 percent decline, following a 0.2 percent boost in May. The average workweek for all workers edged down to 34.1 hours compared to 34.2 hours in May. The market forecast was for 34.2 hours.
The good news at face value in the June report was that the unemployment rate to 9.5 percent in June from 9.7 percent in May. However, the decrease was due to a sharp drop in the labor force.
Overall, the June jobs reports points to a softening in the labor market. Private employment continues to grow, but at a more moderate pace. On the news, markets were uncertain of how to react as equity futures moved back and forth.

“Marginally attached” and “discouraged” workers rose a combined 829,000 from a year earlier – that is one way the size of the labor force falls while the population rises. Below is a chart of the Employment Population Ratio, the plunge resumes despite population that continues to rise:

The net 240k loss of government workers did not materialize, it came in with a net loss of 208,000.
Below is a full copy of the BLS Employment Situation Report:
empsitJune
Looking at the Alternative Measures table, we find that not seasonally adjusted U-6 jumped from 16.1 to 16.7%. Seasonally adjusted fell from 16.6 to 16.5%. Note the one year ago rate figures for both U-3 and U-6 - there has been basically no change in the unemployment rate in the past year, I guess we have Obama to thank for that, LOL, and we won't mention the fact that we are bankrupt as a nation:

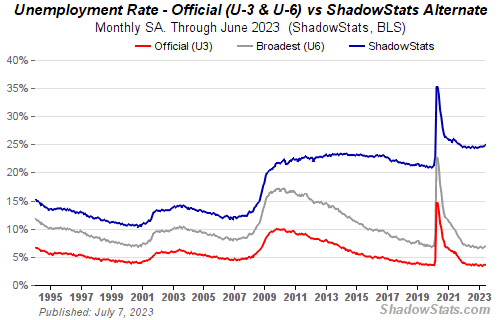
These are the numbers that more closely resemble the way the statistics were reported in the past but are not a perfect comparison by any means. For a more consistent report over time, we cannot rely on government data, so we turn to John Williams at Shadowstats.com:
Below is the completely whack “Birth/ Death Model” adjustments. They fell, as I predicted, from 215k to 147k. This number is very likely to be negative for July, it typically is for that month:

Overall this report was fairly close to consensus, but shows that the labor force is still shrinking. This is because there are fewer jobs and it’s been forevvveeerrr, and thus the number of people just giving up is very high, and also there are people who are flat out running off the rolls as their benefits have run out. For them, depression is absolutely the correct term. Is this like other “recessions?” Heck no, and here’s proof – the Mean Duration of Unemployment has never been higher:

Factory Orders were reported sharply lower this morning, falling from a positive 1.2% to a negative 1.4%! Consensus was expecting a fall to -.5%, but this is another big miss and yet another sign that the economy is falling sharply without the trillions in stimulus.
Yesterday, the Motor Vehicle Sales report continues to look very weak. Total sales came in at 11.1 million, down from 11.6 million. Pre-depression numbers were in the 16 million + range, here’s Econoday:
Vehicle sales were weak in June in an early indication that retail sales may prove disappointing for a second month in a row. Unit sales of domestic-made cars and light trucks came in at an 8.4 million annual rate vs. May's 8.9. Adding in imports and the comparison shows an 11.1 million rate vs. 11.6 in May for a 4.5 percent decline.
Looking at the markets, there are signs that we may have reached a temporary bottom, but the primary count we were using is slightly off if a bottom materializes today. The working count says that we should just be starting wave 3 of 3 of 3 (of 1). The alternative is that I was correct the other day when the wave count didn’t look fully formed and that we just bottomed on wave 1 of 3 of 3 yesterday and are now beginning wave 2 for a couple of days. Either way, a steep plunge should follow relatively soon.
Below is a ten day chart of the SPX. You can see that prices are challenging the channel top that’s been holding prices:

Updating the look at the Chinese Shanghai Index versus the SPX, you can see that our recent declines have not closed the gap with China's markets continuing to lead to the downside. I keep reading analysts who continue to shout that they are going to lead us up, but that's simply not happening:

The CBOE Put/Call ratio rose to 1.25 yesterday, that is nearing levels where one would expect a bounce to occur.

Also a bullish divergence yesterday was the VIX that fell by about 5%. Besides those two indications, however, I did not see anything that looks amazingly bullish, divergent, or contrarian otherwise. So, the people who do not count the waves might be looking for a bounce, the surprise therefore would be that the bounce does not materialize for them – and that may lead to a little panic on their part, we’ll see.
Don’t forget that we are sitting on a three day weekend… holding positions over it will be risky, if you are a bull, don’t look up, it’s a long way to the top!
AC/DC – It’s a Long Way to the Top if you want to Rock-n-Roll: