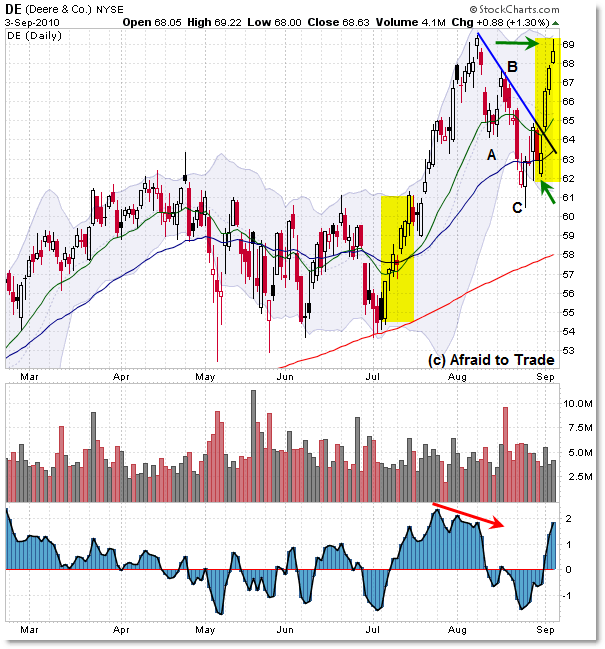
Did you see the strength in Deere & Co (DE) last week?
If you missed it, here’s a closer look and what it might mean for the bigger picture if the stock breaks above key resistance to new recovery highs.

For the rest of the story and more charts visit
http://blog.afraidtotrade.com/did-you-last-weeks-rally-in-deere-de-a-closer-look/
The State of the U.S. Banking System (Q2 2010)
The State of the U.S. Banking System (Q2 2010)
- John Lee
- September 6th, 2010
Q2 2010 was the best quarterly profit in almost three years for the U.S. banking sector. Upon further inspection, it is true. Despite a growing number of failed banks (hey, no failed banks this weekend!), the sector is, in fact, slightly improving. Is this temporary? Who knows, but from the way things looks, they are getting better (way better than 2 years ago).
In addition to the growing list of bank failures, the list of “troubled” banks also grew, to 829. During the same period in 2009, the total was 416. This equates to about 10% of small banks being “in trouble” and this is the highest rate in about 17 years. Collectively, these troubled banks hold assets of $403.2 billion. We would need to see a drop in both lists. The number of thrifts and independent banks fell by 54% from 1994 till now. We also saw zero new charters given, a still suppressed level of mergers, and of course, an increase in failures.
Between international banks, agri-banks, credit card lenders, commercial lenders, mortgage lenders, consumer lenders, and “others”, only the commercial lenders are seeing a steady positive annual trend of asset growth. All others have fallen dramatically from their ’90s highs. There are 2,740 institutions (35%) with less than $100 million in assets and 4,422 institutions (56.5%) with assets between $100 million to $1 billion. There are 105 institutions (1.3%) with greater than $10 billion in assets. Collectively, this group controls 78% of all assets.
Banks reported actual net income in Q1 and also Q2 of 2010. It looks like we’re on the right track here. 65.5% of banking institutions reported positive earnings. Loss provisions have decreased. Both ROE and ROA also increased as a whole. The top states with the highest return-on-assets are Alaska, Massachusetts, New Mexico, North Dakota, Virginia, and Oklahoma. The states (or territories) with the worst were South Carolina, Arizona, Michigan, Georgia, Puerto Rico,and Washington.
Residential loans still top the loan portfolio composition at 25%. The next three biggest are “other loans”, non-farm nonresidential, and commercial & industrial loans. As for negative growth, the annual growth rate for construction and land development loans fell by -28.45% and 1-4 family residential property loans fell by -5.83%. Commercial & industrial loan volume is improving, but still down with a quarterly change of -$12 billion. 1,137 institutions possess construction loans that exceed total capital vs. a high of 2,376 in December 2007.
In general, the highest loan charge-offs include real estate (43% of total), credit cards (38% of total), and commercial & industrial (11% of total). Credit card loss rates stand at over 10%. Personal bankruptcies are now numbering over 400,000. Loans to small businesses dropped around -4% but loans to medium/large businesses saw a decline of -23% from the 2008 highs.
We also saw a shift in both debt and equity securities from Q2 2008 till present. U.S. Treasuriesgrew to $165 billion (from $24 billion in Q2 2008) while equity securities declined to $19 billion(from $27 billion in Q2 2008). “Other” debt securities more than doubled to $457 billion (from $200 billion in Q2 2008).
The deposit insurance fund’s (DIF) reserve ratios are still negative at -0.28%. It’s been negative since September 2009. The DIF, as you know, has labels to identify capitalized and undercapitalized banks. Currently. 7,489 institutions (or 95.6% of total) are “well capitalized”. 152institutions (1.9% of total) are “adequately capitalized”. 81 institutions (1% of total) are “undercapitalized”. 61 institutions (0.8% of total) are “significantly undercapitalized”. Finally, 47institutions (0.6% of total) are “critically undercapitalized”. The “well capitalized” capital category of institutions control 98.8% of all assets. The “critically undercapitalized” capital category of institutions control just 0.1% of all assets.
There has been an increase in bank derivatives, specifically in interest rate futures/forward contracts and interest rate swaps. Other derivatives remain fairly constant. The 7 largest participants in the commercial bank derivatives space control $206.8 trillion, or 99% of total. In contrast, All other participants totaling 1,052 institutions control $2.7 trillion, or just 1%. As for securitized assets, mortgage loans account for 84%, still by far, the highest of all other types of securitized assets.
Tons of Charts on Lee's website located here: