The Big Picture
By Colin Twiggs
July 5th, 2011 3:00 a.m. ET (5:00 p.m. AET)
July 5th, 2011 3:00 a.m. ET (5:00 p.m. AET)
These extracts from my trading diary are for educational purposes and should not be interpreted as investment or trading advice. Full terms and conditions can be found at Terms of Use.
Technical Instability
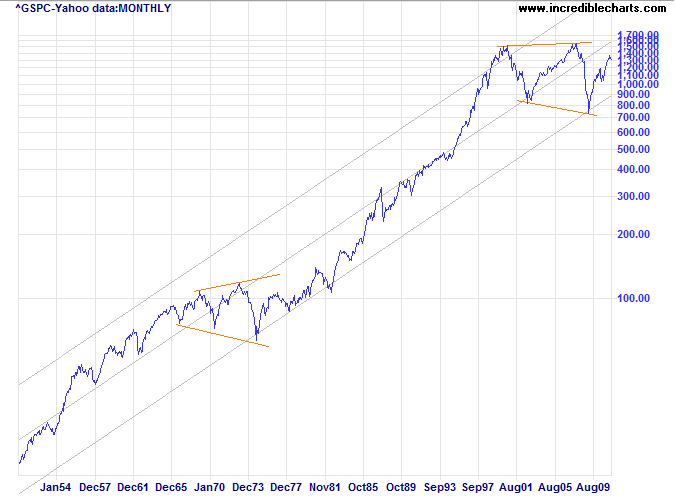
The market is currently experiencing volatility on a scale last witnessed in the 1930s. The S&P 500 chart for the last 60 years (semi-log scale with trend channel at 3 standard deviations, data courtesy of Yahoo: symbol y_^gspc) shows a broadening formation, starting in 2000, of greater magnitude than anything since the 1930s. The stagflation era of the 1970s is small by comparison, and the crash of October 1987 barely noticeable.

We are not out of the woods yet. High above the 700/800 lows is an inherently unstable situation. A failed down-swing, similar to the 1977-79 trough that respected the lower trend channel, would establish a new base on which the market can build.
3 Fundamental Issues
Lot's a good stuff here to chew on: http://www.incrediblecharts.com/tradingdiary/trading_diary.php#technical