Equity futures are creeping higher again this morning as we launch into a new quarter and new month. The dollar is higher, bonds are higher, oil is lower, gold & silver are making sizable corrections lower, and most food commodities are sharply lower as well.
Confused over the possibility of a significant decline in Quantitative Easing, all whilst massive money printing is still ongoing, the dollar has etched out a triangle as has the schizoid Euro. Below are daily charts of the dollar on the left and euro on the right. The euro ran into resistance at the same time the dollar hit support within that triangle, and thus for the equity trend to continue we need the currencies to bust out of, and run, from those triangles:

Of course “injecting” another $124 Billion into Greece will work out peachy, just like the last iteration of print money from nothing, take real assets and productive people’s efforts, robbery. I’d say that it will work out the same as last time, but that’s not the way debt works, it will work out worse than last time because the effects are cumulative, just like the nuclear hot particles we are all consuming.
Speaking of hot particles, if you haven’t heard Arnie Gunderson’s latest interview yet, you should. It’s an hour long, but worth it: Arnie Gunderson Interview
Motor Vehicle Sales are reported throughout the day today, “Consumer” Sentiment, Construction Spending, and the Manufacturing ISM will all be released at 10 Eastern this morning. Of course we’ll report on these inside of today’s daily thread.
M2 money supply was reported yesterday as gaining $30 Billion in the week, this is up tremendously from the previous week’s $11.7 billion (which is still a ton).
Looking at the money supply charts, the St. Louis “Fed” is actually doing a better job of breaking out the component money supply parts. They are also finally including explanations about how they calculate each chart. I noticed that they broke out Small Time Deposits and that when they do, it produces an M2 Minus chart that clearly shows the parabola nature of the “Fed’s” Ponzi debt backed money:

All parabolas eventually collapse, this one will be no different.
According to the “Fed,” “The small-denomination time deposits component of M2 includes time deposits at banks and thrifts with balances less than $100,000.” That would be pretty much everyone in the middle-class and lower, right? So, let’s take a look at just the Small Time Deposits component of M2:

Straight up, then straight down. Note that the straight down part is still ongoing. I think that says a ton about the winners and the losers of “Quantitative Easing,” and about corporate capture of government in general. Ehhh, be quite, swallow a few more hot particles, and get back to “producing,” whatever that means in America these days (I think it’s going to mean taking care of a lot of cancer patients about a decade from now).
Just as a refresher, here’s the current Base Money chart:

And here’s the hot money effect on the M1 Multiplier which is setting new lows:

This latest rally is one to be careful of in my opinion. The market is already very overbought with the major indices all now above their 50dma’s, but also well above their upper Bollinger Bands. Of course the difference between now and just a week ago is nothing but more debt for Greece, and I can thus guarantee that we’ll be revisiting the debt issues again shortly, as in very shortly. Note that the time intervals between debt driven events are growing shorter and shorter, the result of exponential impossible math.
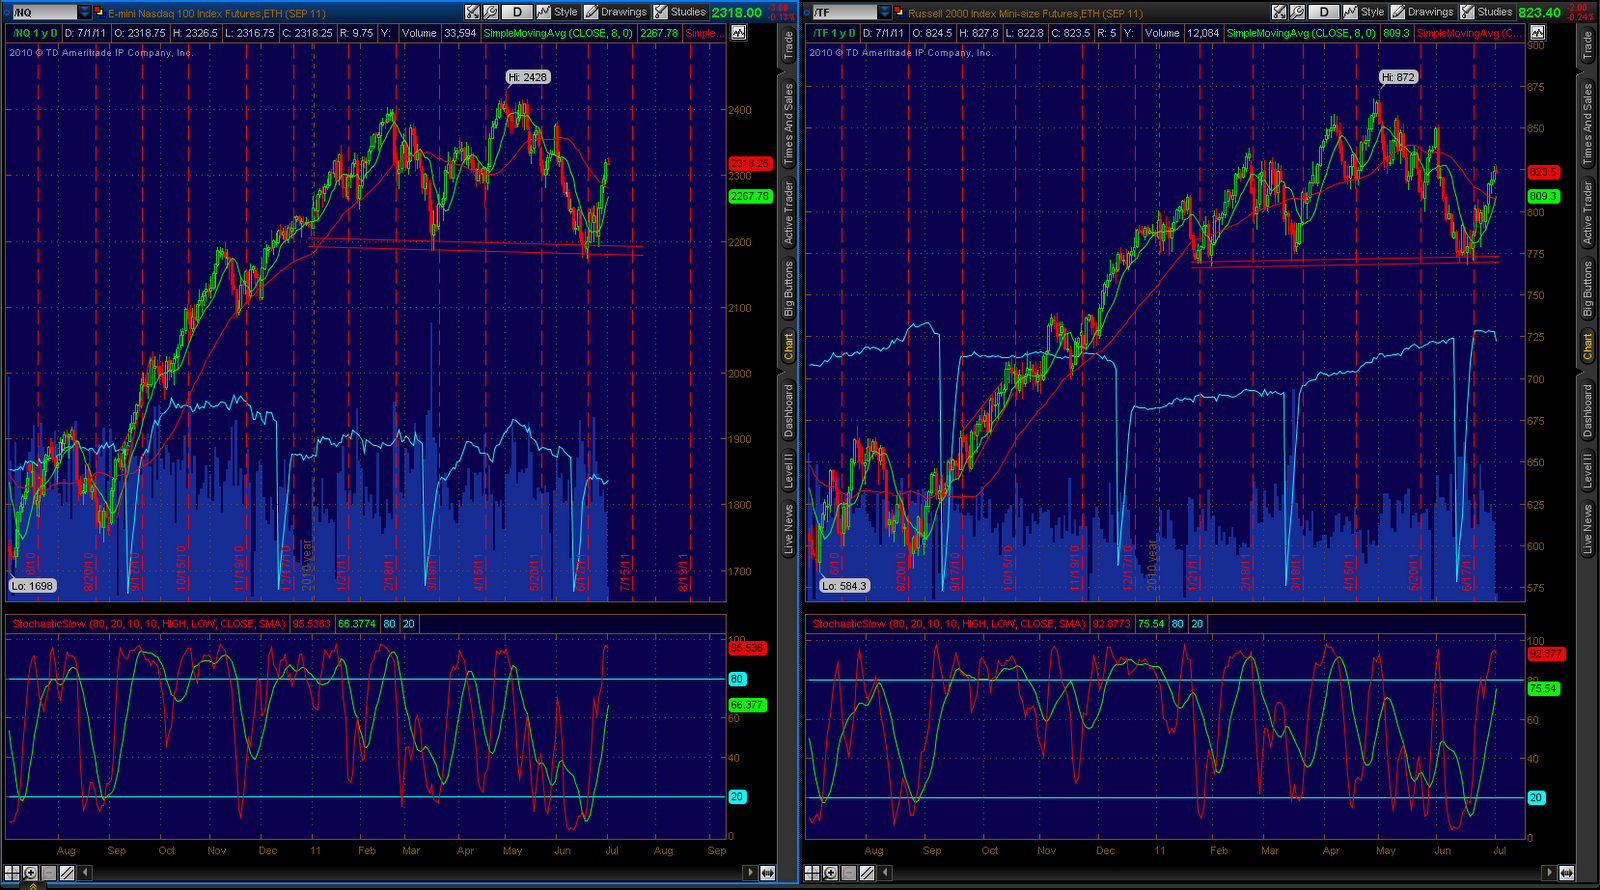
Below is a daily chart of the NDX on the left and Russell 2000 on the right. Both have formed pretty clear Head & Shoulder’s patterns, the right shoulder is now formed and thus I would not be surprised by a turn back down to the neckline soon. Of course exceeding the top of the Head would nullify this pattern, but there it is: