Posted for your consideration relative to current events... (ht Kevin)
Morning Update/ Market Thread 1/18
Good Morning,
Equity futures are slightly lower in general with the NDX lower due to AAPL being down 5% this morning. The dollar is lower and is flirting with a support level in the 78.8 area, bonds are down sharply just prior to the open, while oil is lower, and gold is higher.
The Empire State Manufacturing Index rose from a relatively low 10.6 to 11.92, this is well below the 14.0 that was the consensus, but is slightly higher than December’s report. Note that December was revised lower to an even weaker 9.89 – here’s Econoday:
Yawn… very slow “growth” here, and remember that many of the index values are first measured in dollars that are not adjusted correctly due to errors in measuring real inflation.
Treasury International Capital (TIC) data for November from the Treasury shows a supposed (no, I don’t believe their data) $39.0 billion net inflow of funds. The Treasury no longer produces this report in .pdf, otherwise I would show the entire report. Diving deeper we find that China was a net seller, while the U.K. was the supposed big buyer. With no international audit trail whatsoever, these numbers are simply not believable and should not be taken at face value from my perspective.
The Housing Market Index is released at 10 Eastern this morning.
The most important and telling economic data this morning comes from the UK where inflation was just reported as climbing steeply to 3.7%, with prices rising 1.0% on a month to month basis (12% annualized). Their “Retail Prices Index” jumped even more, climbing to 4.8%. This from a central bank whose official target is 2.0%. This from a country who is imposing austerity measures and who just imposed a higher VAT on its people – riots to commence in the near future.
Speaking of riots, pay attention to events in Sudan and in the Ivory Coast, two despot lead nations that are likely next in the Tunisia like revolution department. By the way, riots in Tunisia continue as the people are not happy with the new coalition government that includes some of the old politicians – they want a completely clean slate.
Citigroup released earnings that failed to meet expectations on both the top and bottom lines. They are claiming profits are up from last year, but in fact Citi’s revenue fell by 6% from a year ago and profits would not have been there without Citi taking smaller write down provisions for it bad debts. In other words, the only way Citi can claim a profit is via accounting fraud, and that is just the tip of the iceberg as they are running shell companies and still marking their “assets” to their own fantasy model.
As I’ve been typing I watched bonds shoot lower just prior to the open, and on the opening bell prices shot higher – the market is completely HFT driven and controlled, completely unnatural. As I’ve been saying, at some point the bankers (who own the HFT machines, own the exchanges, own the “Fed,” and produce false money to fuel their HFTs) will fail to get their way. We have stupidly given a very small minority complete control of our money system, of our economy, and by extension our political system.
Equity futures are slightly lower in general with the NDX lower due to AAPL being down 5% this morning. The dollar is lower and is flirting with a support level in the 78.8 area, bonds are down sharply just prior to the open, while oil is lower, and gold is higher.
The Empire State Manufacturing Index rose from a relatively low 10.6 to 11.92, this is well below the 14.0 that was the consensus, but is slightly higher than December’s report. Note that December was revised lower to an even weaker 9.89 – here’s Econoday:
Highlights
Manufacturing activity is accelerating in the New York region this month according to the Empire State general business conditions index which rose more than two points to 11.92, a reading well over the breakeven zero level and slightly above December's revised growth of 9.89. New orders show significant acceleration to 12.39 vs December's 2.03 and vs November's steep contraction of minus 23.80. Shipments, which follow new orders, accelerated to 25.39 from 7.16 in December and from minus 5.27 in November.
The gains however are far from straining the supply chain, a factor that points to limited gains ahead for employment. Unfilled orders extended their long run of contraction while deliveries continue to speed up, not slow down. Inventories, at plus 4.21, show a build this month but follow a run of draws.
Employment did rise in the month, to 8.42, but the slack in unfilled orders and lack of pressure in deliveries suggest that existing capacity is sufficient to meet production needs. Still this report, especially the new orders index, is positive for the outlook hinting at an incremental gain for the nation's manufacturing sector during January. The Philly Fed will release its manufacturing report for the Mid-Atlantic region on Thursday.
Yawn… very slow “growth” here, and remember that many of the index values are first measured in dollars that are not adjusted correctly due to errors in measuring real inflation.
Treasury International Capital (TIC) data for November from the Treasury shows a supposed (no, I don’t believe their data) $39.0 billion net inflow of funds. The Treasury no longer produces this report in .pdf, otherwise I would show the entire report. Diving deeper we find that China was a net seller, while the U.K. was the supposed big buyer. With no international audit trail whatsoever, these numbers are simply not believable and should not be taken at face value from my perspective.
The Housing Market Index is released at 10 Eastern this morning.
The most important and telling economic data this morning comes from the UK where inflation was just reported as climbing steeply to 3.7%, with prices rising 1.0% on a month to month basis (12% annualized). Their “Retail Prices Index” jumped even more, climbing to 4.8%. This from a central bank whose official target is 2.0%. This from a country who is imposing austerity measures and who just imposed a higher VAT on its people – riots to commence in the near future.
Speaking of riots, pay attention to events in Sudan and in the Ivory Coast, two despot lead nations that are likely next in the Tunisia like revolution department. By the way, riots in Tunisia continue as the people are not happy with the new coalition government that includes some of the old politicians – they want a completely clean slate.
Citigroup released earnings that failed to meet expectations on both the top and bottom lines. They are claiming profits are up from last year, but in fact Citi’s revenue fell by 6% from a year ago and profits would not have been there without Citi taking smaller write down provisions for it bad debts. In other words, the only way Citi can claim a profit is via accounting fraud, and that is just the tip of the iceberg as they are running shell companies and still marking their “assets” to their own fantasy model.
As I’ve been typing I watched bonds shoot lower just prior to the open, and on the opening bell prices shot higher – the market is completely HFT driven and controlled, completely unnatural. As I’ve been saying, at some point the bankers (who own the HFT machines, own the exchanges, own the “Fed,” and produce false money to fuel their HFTs) will fail to get their way. We have stupidly given a very small minority complete control of our money system, of our economy, and by extension our political system.
Holiday Update – Signs of a Potential Top…
Of course today is a holiday and thus markets are closed. However, events in play are adding to the feeling that a potential top in the market is in or is close at hand. I’ll get to the technical market aspects in a moment, but first let’s consider some “other” events.
Tunisia’s revolution is another feather in the cap of freedom as another tyrant is removed from power, this time in Northern Africa. Ben Ali’s regime was high on the scale of despotism despite a relatively high standard of living compared to surrounding countries. This revolution has other despot countries, such as Egypt, on notice and now on guard. In fact Egypt’s, and many other tyrannical countries’ markets, are under heavy selling pressure today. My hope is that the new government gets the money system right alongside of their political system – they must both work together to produce true freedom. Stay away from the world’s private banks, look towards Iceland as a model.
DEBT is pressuring many other parts of the globe as well. Spain, Portugal, and Belgium just cancelled market based bond auctions in favor of more secretive private bank run auctions as demand was obviously not there. Europe is a basket case, with all countries in debt trouble. Bankrupt countries like Japan stand no chance of providing any real help to Europe, the best they can accomplish is to further destroy their own currencies. The ECB would like for the IMF to create more phony money to bail their whole debt based system out by providing more debt! This is laughable and is so far removed from reality that one must seriously question banker and political sanity.
It matters not, as all debt-based global monetary systems are in a state of free-fall. Food riots? No mention in the press as to the real root cause, namely the debasement of money. Real people go hungry when bankers get greedy, thus you will see more revolution and more violence throughout the world – these are the “other” events that history says are coming.
Yet here in America we are still playing ostrich with our collective heads in the sand. Our media at best can now acknowledge that our national debt is “Ugly:”
No, the real unfortunate is that both parties are wrong, and so is the author of this article. The reality is FAR AND AWAY more UGLY than that!
Our current national debt has entered a parabolic growth phase, and because it went parabolic on banker bailouts, instead of acknowledging the debt, we now “expand the Fed’s balance sheet” by trillions. We use false accounting so bad that our country’s own chief accountants haven’t been willing to sign off on our financials for years. We fail to use GAAP accounting principles and thus ignore our promises and liabilities. We have lowered interest rates on each economic cycle to accommodate more and more DEBT, and now the private banks (the “Fed) has resorted to all out money printing. So much so, that this month there are 19 of 20 market days with POMO operations adding up to an incredible $112 billion in just one month!
Think about how large that parabolic figure is! It is nearly THREE TIMES our nation’s trade deficit! Think about that! There is no way it can end and still maintain the façade of economic or market growth, no way. In fact, the numbers MUST GET LARGER or the apparent growth ends. And that’s just one reason why finding physical gold and silver is getting harder and harder – the latest report showing that the European silver shortage is striking the U.K.
And how are equity markets priced? Ridiculous and fraudulent is all I can say. Fraud is rampant and now condoned, here’s yet another example of accounting fraud: US Banks Reporting Phantom Income on $1.4 Trillion Delinquent Mortgages.
With QE2 slated to end by June of this year, look for another banker induced crisis to generate enough angst to get QE3 or TARP 12,000 or whatever they call the next bailout – it will be necessary.
Just look at what has transpired in the Municipal Debt markets over the past couple months and in the past 3 weeks in particular. I talked about it coming years ago, I talked about it as the current CRASH began, and I’m talking about it again because there are so many Muni funds crashing to new 52 week lows, that the NYSE new lows number shot up to 153! This figure is high enough to generate another Hindenburg Oman, however, the McClellan Oscillator is just positive and thus another one was not triggered this week. This split in the market is a warning that should not be ignored, it is yet another expression of the sickness created from debt saturation. Municipalities are in big trouble, especially if their cost of financing sky rockets. Below is a weekly chart of the S&P National Municipal Bond Fund, it has already fallen 9.4% from its peak just a couple of months ago:

The market is now so concentrated in a few hands, and the indices are so weighted by just a few momo stocks, that the slightest hiccup can produce very large and sudden movements. Witness the NDX which is now comprised of 20% AAPL. Steve Jobs just announced he is stepping back out of the company on medical leave and though it is a holiday, shares trading in Germany are off 8%, and look at the effect it just had on the Q’s this morning:

In the short time frame, the SPX is up against the top of its latest channel which is inside of a larger rising wedge, and you can see how price is diverging (still) against a declining RSI (showing waning momentum):

Ultimately something has got to give. Right now it is food and commodity prices. They shoot up to destroy people’s standard of living and the poor countries are negatively impacted first as they have less marginal ability to absorb price shock – thus revolutions and violence – the root cause of which are our own private bankers who cleverly call themselves the “Fed.”
What’s next to give? Can the markets actually fall with $112 billion a month in direct support? What happens when the primary dealers (who happen to own the “Fed) own all of the stock? What happens when they don’t get their way? What happens when municipalities fail, what excuse can be found/generated to bail them out? What happens when the revolution moves from Tunisia, to Egypt, then into Europe, and then onto the U.S.? Will we ever be smart enough to produce and control our own money system by removing the private banks from it?
Technically the markets are HISTORICALLY overextended even with trumped up valuations (valuations are not real, they are fraudulent). Never before in the past 82 years of modern history have stock prices remained above their 10 day moving average for 30 straight days as they have now!
Bullish sentiment is extreme, the CBOE Put/Call ratio is at the lowest point in the past 3 years. Note on the chart below how extreme lows tend to correlate with stock market tops. Also note how this past week’s close of .57 is lower than all the other weekly lows that occurred at lower price levels, thus creating yet another market divergence of which there are more than I can recall ever seeing:

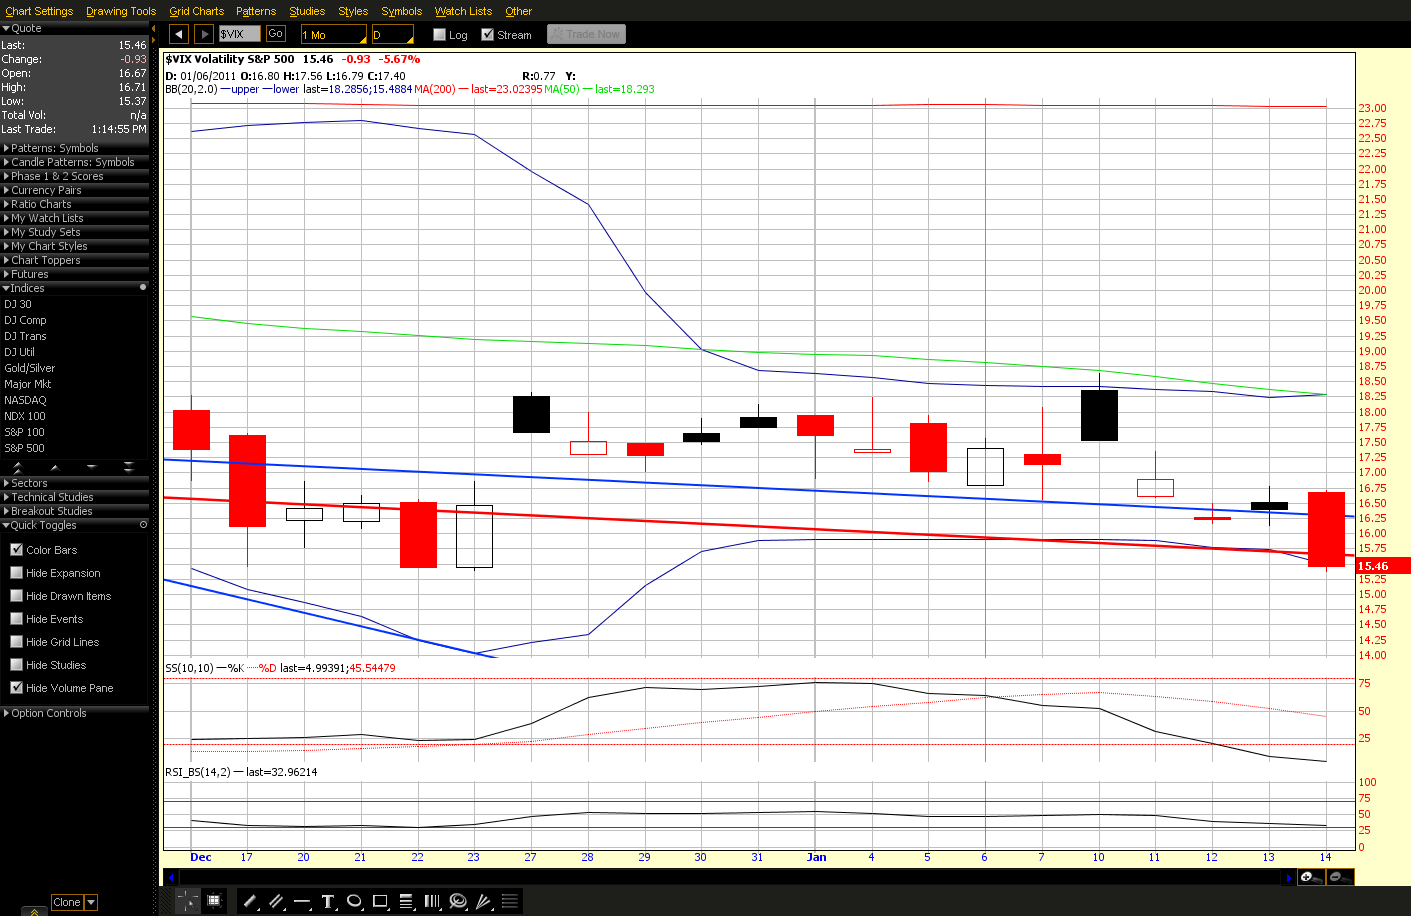
The VIX closed a daily candle on Friday beneath the lower Bollinger Band, thus setting up an entire market sell signal once the VIX returns to within the confines of 2.0 deviation bands:

Money and Markets just posted the following chart comparing the CRB to the Baltic Dry Shipping Index. It shows a giant sized divergence that is, I believe, a direct indication of MONETIZATION. It shows that commodities are zooming in price not due to demand, but simply due to global money printing. Note that this chart was also divergent prior to the late ’07 top:

The markets are now into areas of very heavy volumetric resistance. The DOW Industrials are now at the same place they peaked in the year 2000, 11 years ago. This area is also the area where the plunge in both the DOW and the S&P began in earnest in 2008 (wave 3). Thus we know there is resistance and under even slightly normal circumstances I would expect a pull-back or at least sideways action for quite some time:

The question then becomes, can POMO power through all that resistance? Again, it boils down to choices… still. Is it okay to starve people throughout the rest of the world? How long until the people become the resistance? Note that when the rule of law breaks down to despotism (corporate fascism here in the U.S.), that eventually the natural rule of law kicks in – other events then occur.
Lastly, there was a very small change in the McClellan Oscillator on Friday, meaning that a large directional price move can be expected Tuesday or Wednesday.
Enjoy your $15 hamburger, $20 is only a few more POMO months away! Other events are in motion and on the way. It’s been a long time coming…
Tunisia’s revolution is another feather in the cap of freedom as another tyrant is removed from power, this time in Northern Africa. Ben Ali’s regime was high on the scale of despotism despite a relatively high standard of living compared to surrounding countries. This revolution has other despot countries, such as Egypt, on notice and now on guard. In fact Egypt’s, and many other tyrannical countries’ markets, are under heavy selling pressure today. My hope is that the new government gets the money system right alongside of their political system – they must both work together to produce true freedom. Stay away from the world’s private banks, look towards Iceland as a model.
DEBT is pressuring many other parts of the globe as well. Spain, Portugal, and Belgium just cancelled market based bond auctions in favor of more secretive private bank run auctions as demand was obviously not there. Europe is a basket case, with all countries in debt trouble. Bankrupt countries like Japan stand no chance of providing any real help to Europe, the best they can accomplish is to further destroy their own currencies. The ECB would like for the IMF to create more phony money to bail their whole debt based system out by providing more debt! This is laughable and is so far removed from reality that one must seriously question banker and political sanity.
It matters not, as all debt-based global monetary systems are in a state of free-fall. Food riots? No mention in the press as to the real root cause, namely the debasement of money. Real people go hungry when bankers get greedy, thus you will see more revolution and more violence throughout the world – these are the “other” events that history says are coming.
Yet here in America we are still playing ostrich with our collective heads in the sand. Our media at best can now acknowledge that our national debt is “Ugly:”
National debt: The ugly facts
NEW YORK -- Commentary: Maya MacGuineas is the director of the fiscal policy program at the New America Foundation.
The facts are ugly. The federal debt, which has averaged less than 40% of the total economy, now represents more than 60%. It's likely to hit 100% in a little oYou want more? Here's more.
Pretty much every impartial analyst has declared the situation unsustainable. And many European countries have already been hit by nervous credit markets worried about their debt levels.
Bottom line: If Congress and the president fail to make changes to current policies, the United States will experience some form of a fiscal crisis.
Not a pretty picture. And yet policymakers continue to drag their feet.
When it comes to fiscal policy, the political system is stuck in posturing mode.
Sorry, the abominable $858 billion tax deal President Obama struck with Republicans last month, in which both sides piled on more to the public debt and called it a win-win, does not qualify as my kind of fiscal compromise.
Geithner's debt ceiling warning
It's time for real compromise.
As long as each political party sees an advantage to delaying, we will continue to inch along, closer and closer to that inevitable crisis.
Last week, both Moody's and Standard and Poor's commented on the need for the United States to make changes or jeopardize its triple-A credit rating. A few years back, such warnings would have seemed inconceivable.
The gridlock comes in part from both sides believing they are right.
Republicans view smaller government as promoting more individual freedoms and as better for the economy because it allows for lower taxes. Fair enough.
Democrats see government as serving a more useful purpose -- one that is particularly justified because of the needs of an aging population, years of under investment and growing income inequality. Also legit.
On top of that, both sides blame the other for having made the problem worse for political reasons. Unfortunately, both are right.
No, the real unfortunate is that both parties are wrong, and so is the author of this article. The reality is FAR AND AWAY more UGLY than that!
Our current national debt has entered a parabolic growth phase, and because it went parabolic on banker bailouts, instead of acknowledging the debt, we now “expand the Fed’s balance sheet” by trillions. We use false accounting so bad that our country’s own chief accountants haven’t been willing to sign off on our financials for years. We fail to use GAAP accounting principles and thus ignore our promises and liabilities. We have lowered interest rates on each economic cycle to accommodate more and more DEBT, and now the private banks (the “Fed) has resorted to all out money printing. So much so, that this month there are 19 of 20 market days with POMO operations adding up to an incredible $112 billion in just one month!
Think about how large that parabolic figure is! It is nearly THREE TIMES our nation’s trade deficit! Think about that! There is no way it can end and still maintain the façade of economic or market growth, no way. In fact, the numbers MUST GET LARGER or the apparent growth ends. And that’s just one reason why finding physical gold and silver is getting harder and harder – the latest report showing that the European silver shortage is striking the U.K.
And how are equity markets priced? Ridiculous and fraudulent is all I can say. Fraud is rampant and now condoned, here’s yet another example of accounting fraud: US Banks Reporting Phantom Income on $1.4 Trillion Delinquent Mortgages.
With QE2 slated to end by June of this year, look for another banker induced crisis to generate enough angst to get QE3 or TARP 12,000 or whatever they call the next bailout – it will be necessary.
Just look at what has transpired in the Municipal Debt markets over the past couple months and in the past 3 weeks in particular. I talked about it coming years ago, I talked about it as the current CRASH began, and I’m talking about it again because there are so many Muni funds crashing to new 52 week lows, that the NYSE new lows number shot up to 153! This figure is high enough to generate another Hindenburg Oman, however, the McClellan Oscillator is just positive and thus another one was not triggered this week. This split in the market is a warning that should not be ignored, it is yet another expression of the sickness created from debt saturation. Municipalities are in big trouble, especially if their cost of financing sky rockets. Below is a weekly chart of the S&P National Municipal Bond Fund, it has already fallen 9.4% from its peak just a couple of months ago:

The market is now so concentrated in a few hands, and the indices are so weighted by just a few momo stocks, that the slightest hiccup can produce very large and sudden movements. Witness the NDX which is now comprised of 20% AAPL. Steve Jobs just announced he is stepping back out of the company on medical leave and though it is a holiday, shares trading in Germany are off 8%, and look at the effect it just had on the Q’s this morning:

In the short time frame, the SPX is up against the top of its latest channel which is inside of a larger rising wedge, and you can see how price is diverging (still) against a declining RSI (showing waning momentum):

Ultimately something has got to give. Right now it is food and commodity prices. They shoot up to destroy people’s standard of living and the poor countries are negatively impacted first as they have less marginal ability to absorb price shock – thus revolutions and violence – the root cause of which are our own private bankers who cleverly call themselves the “Fed.”
What’s next to give? Can the markets actually fall with $112 billion a month in direct support? What happens when the primary dealers (who happen to own the “Fed) own all of the stock? What happens when they don’t get their way? What happens when municipalities fail, what excuse can be found/generated to bail them out? What happens when the revolution moves from Tunisia, to Egypt, then into Europe, and then onto the U.S.? Will we ever be smart enough to produce and control our own money system by removing the private banks from it?
Technically the markets are HISTORICALLY overextended even with trumped up valuations (valuations are not real, they are fraudulent). Never before in the past 82 years of modern history have stock prices remained above their 10 day moving average for 30 straight days as they have now!
Bullish sentiment is extreme, the CBOE Put/Call ratio is at the lowest point in the past 3 years. Note on the chart below how extreme lows tend to correlate with stock market tops. Also note how this past week’s close of .57 is lower than all the other weekly lows that occurred at lower price levels, thus creating yet another market divergence of which there are more than I can recall ever seeing:

The VIX closed a daily candle on Friday beneath the lower Bollinger Band, thus setting up an entire market sell signal once the VIX returns to within the confines of 2.0 deviation bands:
Money and Markets just posted the following chart comparing the CRB to the Baltic Dry Shipping Index. It shows a giant sized divergence that is, I believe, a direct indication of MONETIZATION. It shows that commodities are zooming in price not due to demand, but simply due to global money printing. Note that this chart was also divergent prior to the late ’07 top:

The markets are now into areas of very heavy volumetric resistance. The DOW Industrials are now at the same place they peaked in the year 2000, 11 years ago. This area is also the area where the plunge in both the DOW and the S&P began in earnest in 2008 (wave 3). Thus we know there is resistance and under even slightly normal circumstances I would expect a pull-back or at least sideways action for quite some time:

The question then becomes, can POMO power through all that resistance? Again, it boils down to choices… still. Is it okay to starve people throughout the rest of the world? How long until the people become the resistance? Note that when the rule of law breaks down to despotism (corporate fascism here in the U.S.), that eventually the natural rule of law kicks in – other events then occur.
Lastly, there was a very small change in the McClellan Oscillator on Friday, meaning that a large directional price move can be expected Tuesday or Wednesday.
Enjoy your $15 hamburger, $20 is only a few more POMO months away! Other events are in motion and on the way. It’s been a long time coming…

Morning Update/ Market Thread 1/14
Good Morning,
Another lower open this morning with the dollar and bonds roughly level, oil and gold are both lower. It was interesting yesterday to see the dollar plunge and to have oil and gold both move lower as well, something to keep an eye on. I believe this was due to the high inflation read with the PPI yesterday, meaning that high inflation will pressure the “Fed” and their continued QE.
The PPI (producer prices) leads the CPI (consumer prices). This morning the CPI also came in hotter than expected, rising .5% in December, up from .1% in November. Of course a lot of the increase has to do with the hot money pushing up the price of oil, and thus when you remove energy from the equation the “core” rate rose “only” .1%. Keep in mind that this number is one of the most highly manipulated numbers our government produces, failing to capture true inflation:
Right, this report fails to capture food inflation. Bad government data only extinguishes confidence, it is imperative that our system of reporting economic data be overhauled as I outlined in Freedom’s Vision.
Retail Sales is another data series that is riddled with error. They are measured in dollars and thus in error due to the errors in measuring the CPI, even when “corrected.” They are also subject to substitution bias, that is when businesses close, it fails to account for the lost sales and instead measures only sales at stores that have been open for one year or longer. It would be easy to simply capture total sales from all stores, but that’s not how it’s measured… therefore in times of economic contraction this error is large, as it is now. In this report, Retail Sales supposedly grew by .6% in December, that is down from November’s .8% and it is less than consensus for another miss. For what it’s worth, here’s Econoday:
Industrial Production is another data series affected by inflation as output is again falsely measured in dollars instead of actual output. In this report it is again energy, but in the form of utilities, that makes it appear stronger than it actually is. The headline number “grew” .8%, this is an increase from November’s .4%, and is above the .5% consensuses. The utilization figure is more reliable and is still at depression era levels, coming in up, but only at 76%. That is a horrid level, a healthy number should be 85% or more, and it’s quite obvious that we won’t be anywhere near that level for years:
Is auto production strong or not? We keep hearing how well sales are going yet report after report is mentioning that autos are not as strong as expected. Autos, in my opinion, are still in bubble price territory, risen there by creative financing in the very same manner that housing was fluffed into a bubble. Car prices need to come down and financing for them needs to be better matched to income with more substantial down payments and shorter financing periods. Regarding overall production, let’s face it… we simply do not produce much of anything anymore, and that will bite us hard in the end. Our manufacturing capital continues to flee overseas leaving our labor market gutted and doomed to produce only financially engineered paper products. But it’s nice to have our children with college degrees making our coffee for us, isn’t it?
Consumer Sentiment came in much weaker than expected… again. Last month it was at a pathetic 74.5 reading, and for this month it fell to 72.7 against a consensus that was looking for it to rise to 75.0. Hey, you can’t fool all of the people all of the time… especially when they are unemployed or flipping burgers with their $40,000 a year education. Stocks are higher on the release... Welcome to Walmart, would you like fries with that?
Business Inventories are released at 10 Eastern.
The momentum indicators in the market continue to look tired. Divergences are again growing in the daily RSI and Stochastic indicators, producing lower highs while price goes on to produce higher highs:

There’s a large degree correction coming, but it may take a while longer to get rolling.
Another lower open this morning with the dollar and bonds roughly level, oil and gold are both lower. It was interesting yesterday to see the dollar plunge and to have oil and gold both move lower as well, something to keep an eye on. I believe this was due to the high inflation read with the PPI yesterday, meaning that high inflation will pressure the “Fed” and their continued QE.
The PPI (producer prices) leads the CPI (consumer prices). This morning the CPI also came in hotter than expected, rising .5% in December, up from .1% in November. Of course a lot of the increase has to do with the hot money pushing up the price of oil, and thus when you remove energy from the equation the “core” rate rose “only” .1%. Keep in mind that this number is one of the most highly manipulated numbers our government produces, failing to capture true inflation:
Highlights
Headline and core CPI inflation seemed to be on different tracks in December as energy jacked up the overall number while core inflation remains modest. The CPI in December jumped 0.5 percent, following a modest 0.1 percent rise the month before. Analysts had projected a 0.4 percent boost for the latest month. Excluding food and energy, CPI inflation came in at 0.1 percent, equaling the rise for November and matching expectations.
By major components, energy jumped 4.6 percent, following a 0.2 percent rise in November. Gasoline spiked a monthly 8.5 percent, following a 0.7 percent increase the prior month. Food price inflation actually slowed to 0.1 percent from 0.2 percent in November.
As in recent months, shelter helped keep the core rate soft. The index for shelter rose 0.1 percent for the third month in a row. The rent index rose 0.2 percent while the index for owners' equivalent rent increased 0.1 percent. Motor vehicles also helped the core. The index for new vehicles was unchanged in December while the used cars and trucks index fell 0.1 percent, its fourth consecutive decline. Also falling in December were the indexes for recreation, communication, and household furnishings and operations.
Year-on-year, overall CPI inflation rose to 1.4 (seasonally adjusted) from 1.1 percent in November. The core rate, however, eased 0.6 percent from 0.7 percent. On an unadjusted year-ago basis, the headline number was up 1.5 percent in December while the core was up 0.8 percent.
Essentially, headline inflation is seeing upward pressure from higher oil prices. While there has been no consistent upward pattern for food prices, there could be higher numbers in coming months from stronger transportation and production costs. Commodities prices have been notably higher recently.
But core inflation is soft due to weak housing and heavy competition among retailers. In coming months, the Fed likely is going to have to address this issue of two track inflation between headline and core numbers.
Right, this report fails to capture food inflation. Bad government data only extinguishes confidence, it is imperative that our system of reporting economic data be overhauled as I outlined in Freedom’s Vision.
Retail Sales is another data series that is riddled with error. They are measured in dollars and thus in error due to the errors in measuring the CPI, even when “corrected.” They are also subject to substitution bias, that is when businesses close, it fails to account for the lost sales and instead measures only sales at stores that have been open for one year or longer. It would be easy to simply capture total sales from all stores, but that’s not how it’s measured… therefore in times of economic contraction this error is large, as it is now. In this report, Retail Sales supposedly grew by .6% in December, that is down from November’s .8% and it is less than consensus for another miss. For what it’s worth, here’s Econoday:
HighlightsIn this report it is obvious how destroying the value of our money creates the ILLUSION of growth… gasoline sales, that are measured in dollars and not gallons, rose to help this index gain. If, however, you were to remove that cost that ripples through the entire system, then sales measured in dollars would not show the apparent growth that’s there. Again, by incorrectly measuring statistics, we are only fooling ourselves and creating a false market and false economy. This report is weak even with the induced errors, I guarantee you that it would be negative if you removed them.
Retail sales looked good at the headline level for December but there were signs of fatigue by consumers after ringing up the cash registers so loudly in November. Overall retail sales in December rose 0.6 percent after jumping 0.8 percent the month before. Although healthy, the December figure fell short of the consensus forecast for a 0.8 percent boost. Excluding autos, sales were not quite as strong, rising 0.5 percent, following a 1.0 percent surge in November. Analysts had called for a 0.7 percent gain. However, higher gasoline prices played a role behind face value strength. Sales excluding autos and gasoline rose a moderate 0.4 percent after a 0.6 percent increase in November.
Notable components include motor vehicles, up 1.1 percent after a 0.2 percent rise in November. There was a significant swing in general merchandise (which includes department stores). This component fell 0.7 percent in December after jumping 1.1 percent the month before.
Overall retail sales on a year-ago basis in December improved to 7.9 percent from 7.5 percent the previous month. Excluding motor vehicles, sales rose to a year-ago 6.7 percent from 6.4 percent in November.
The bottom line is that consumers front loaded holiday purchases (broadly defined core sales) in November and some softening in December is not surprising. But the softness was modest as sales were still healthy in December even after discounting some price effects. Consumers with jobs are now pulling their weight keeping the recovery going.
On the news, equities were little changed.
Industrial Production is another data series affected by inflation as output is again falsely measured in dollars instead of actual output. In this report it is again energy, but in the form of utilities, that makes it appear stronger than it actually is. The headline number “grew” .8%, this is an increase from November’s .4%, and is above the .5% consensuses. The utilization figure is more reliable and is still at depression era levels, coming in up, but only at 76%. That is a horrid level, a healthy number should be 85% or more, and it’s quite obvious that we won’t be anywhere near that level for years:
Highlights
The manufacturing sector continues to lead the recovery based on December data-but not quite as strongly as suggested by the headline for industrial production. Industrial production posted a healthy 0.8 percent gain, following a 0.3 percent rebound in November. The December figure came in higher than analysts' estimate for 0.5 percent. However, the boost was led by a monthly 4.3 percent surge in utilities output, following a 1.5 percent increase in November. Utilities were up on atypically cold weather.
Nonetheless, manufacturing increased a healthy 0.4 percent after a 0.3 percent rise in November. The latest was softened by a 0.2 percent dip in motor vehicle output. Excluding autos, manufacturing advanced 0.5 percent after a 0.6 percent boost in November. So, manufacturing is still on a significant uptrend. With motor vehicle sales somewhat strong, auto assemblies are likely to pick back up soon.
For the remaining major industry group, mining rebounded 0.4 percent after declining 0.7 percent in November.
Overall capacity utilization continued to improve, rising to 76.0 percent in December from 75.0 percent in November. December's figure beat expectations for 75.6 percent.
The bottom line is that while the utilities component has been volatile and led to swings in the headline production number, manufacturing is on a moderately healthy uptrend.
Is auto production strong or not? We keep hearing how well sales are going yet report after report is mentioning that autos are not as strong as expected. Autos, in my opinion, are still in bubble price territory, risen there by creative financing in the very same manner that housing was fluffed into a bubble. Car prices need to come down and financing for them needs to be better matched to income with more substantial down payments and shorter financing periods. Regarding overall production, let’s face it… we simply do not produce much of anything anymore, and that will bite us hard in the end. Our manufacturing capital continues to flee overseas leaving our labor market gutted and doomed to produce only financially engineered paper products. But it’s nice to have our children with college degrees making our coffee for us, isn’t it?
Consumer Sentiment came in much weaker than expected… again. Last month it was at a pathetic 74.5 reading, and for this month it fell to 72.7 against a consensus that was looking for it to rise to 75.0. Hey, you can’t fool all of the people all of the time… especially when they are unemployed or flipping burgers with their $40,000 a year education. Stocks are higher on the release... Welcome to Walmart, would you like fries with that?
Business Inventories are released at 10 Eastern.
The momentum indicators in the market continue to look tired. Divergences are again growing in the daily RSI and Stochastic indicators, producing lower highs while price goes on to produce higher highs:

There’s a large degree correction coming, but it may take a while longer to get rolling.
Subscribe to:
Comments (Atom)